Autumn AI
A new frontier of data collection and reporting in a friendly, purposeful package.
Context
Autumn is a behavioral analytics tool that uses AI to collect data and identify trends. The role of the UI and content is to communicate those trends in a way that’s meaningful and useful to the end users. End-users are managers and individual contributors working on teams together. Autumn aims to be a compliment to Qualtrics core offering — surveys — by providing the end-user meaningful data to action in in-between quarterly survey feedback. Our goal was to validate our assumptions about what data/content relationships make Autumn intelligence useful to end users in between quarterly surveys and to redesign the dashboard to reflect it.
My input
Discovery 💡
• Review Autumn use cases
• Draw from the persona workshop journey map and known pain points
• Collaborate with UXR on foundational research on artificial intelligence and trust
• Collaborate with methodology on validated social science correlations
Concept generation and frameworks 📐
• Design dashboard concept sketches driven by research and relational data storytelling
• Sketch tagging systems and information architecture
Final design 〰️
• Worked with UX partner to translate the concept into the final design
• Content design including explainability and ethical disclosure patterns
• Guided and collaborated with methodology on platform-level requirements for explainability
• Consult on application of platform requirements for AI-powered products
Discovery 💡
From our persona workshop, we understood that our target persona experienced core pain points in the listen and act phases of the journey. The gaps between survey data collection were too long — so managers didn’t know if the actions they took made a meaningful difference. Autumn aimed to solve this pain point by collecting behavioral data in between surveys – but aligning the Autumn methodology to the customers takes time, and we needed a way to drive value for managers, quickly.
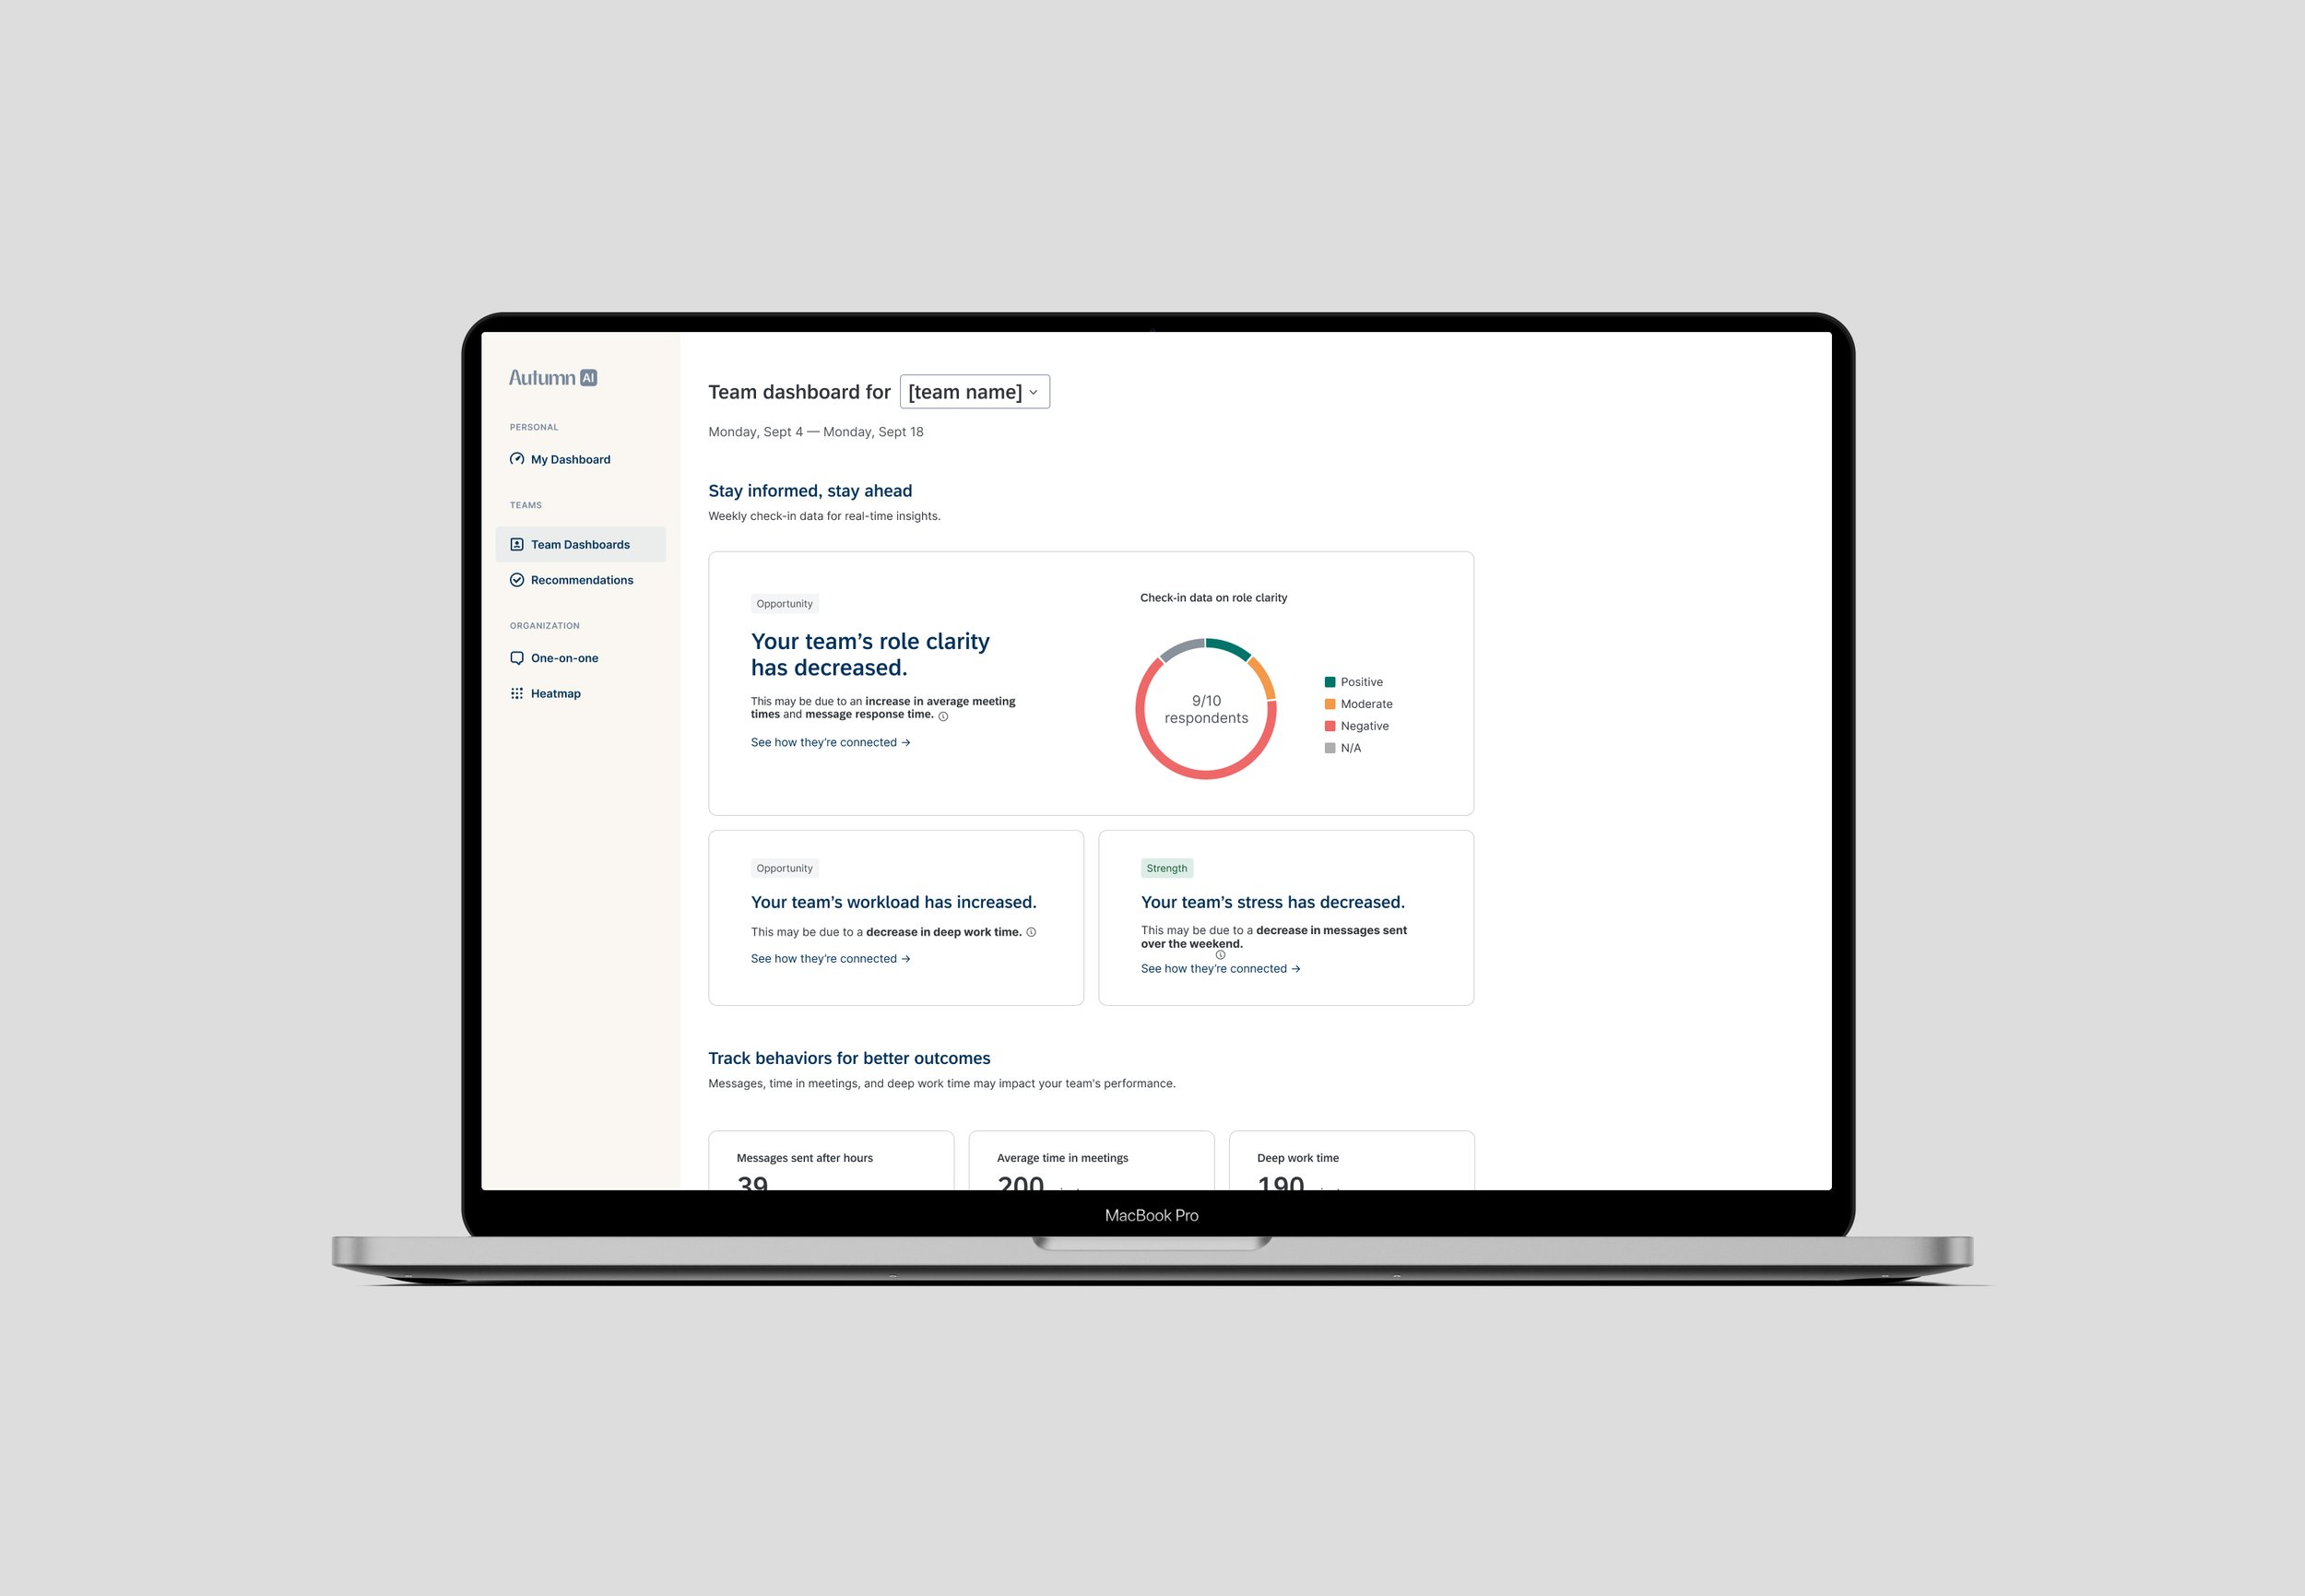
For Autumn to be useful to end-users, user research told us that we need to deliver data that is: reliable, explainable, and valuable. And as a designer, I believed that Autumn needed to move from discrete data insights (e.g. “Your team well-being score is X”) to relational insights (e.g. “Your team’s well-being score is X because Y has significantly increased.”) to show actionable habits impact scores. It’s not enough to tell users what their data is — we need to show them why it matters. Hopefully, these small, iterative steps add up to big results for the manager when the quarterly survey results are in.

Concepts 📐
We held a design workshop to iterate on potential concepts for the dashboard. I started by evaluating the core potential content types and data outputs from Autumn and arranging them hierarchically on a page with interchangeable sticky notes. Then, I consulted early methodology data-flows to understand the relationship between data types to begin to form a story. I noticed that methodology believed there’s a correlation between certain types of data that are statistically significant. But how to communicate it?
I sketched out low-fidelity mock-ups to illustrate a relational story framework — translating the data into a digestible narrative.

Final design 〰️
The final product concept for Autumn reflects the team’s hypothesis on the methodological relationship between data types.
In simple terms?
”If you do x, it might lead to y.” This relational storytelling strategy helps solve one of the end-user’s biggest pain points: understanding the impact of actions, and understanding how actions impact scores. This relational storytelling technique became the default across the product experience.
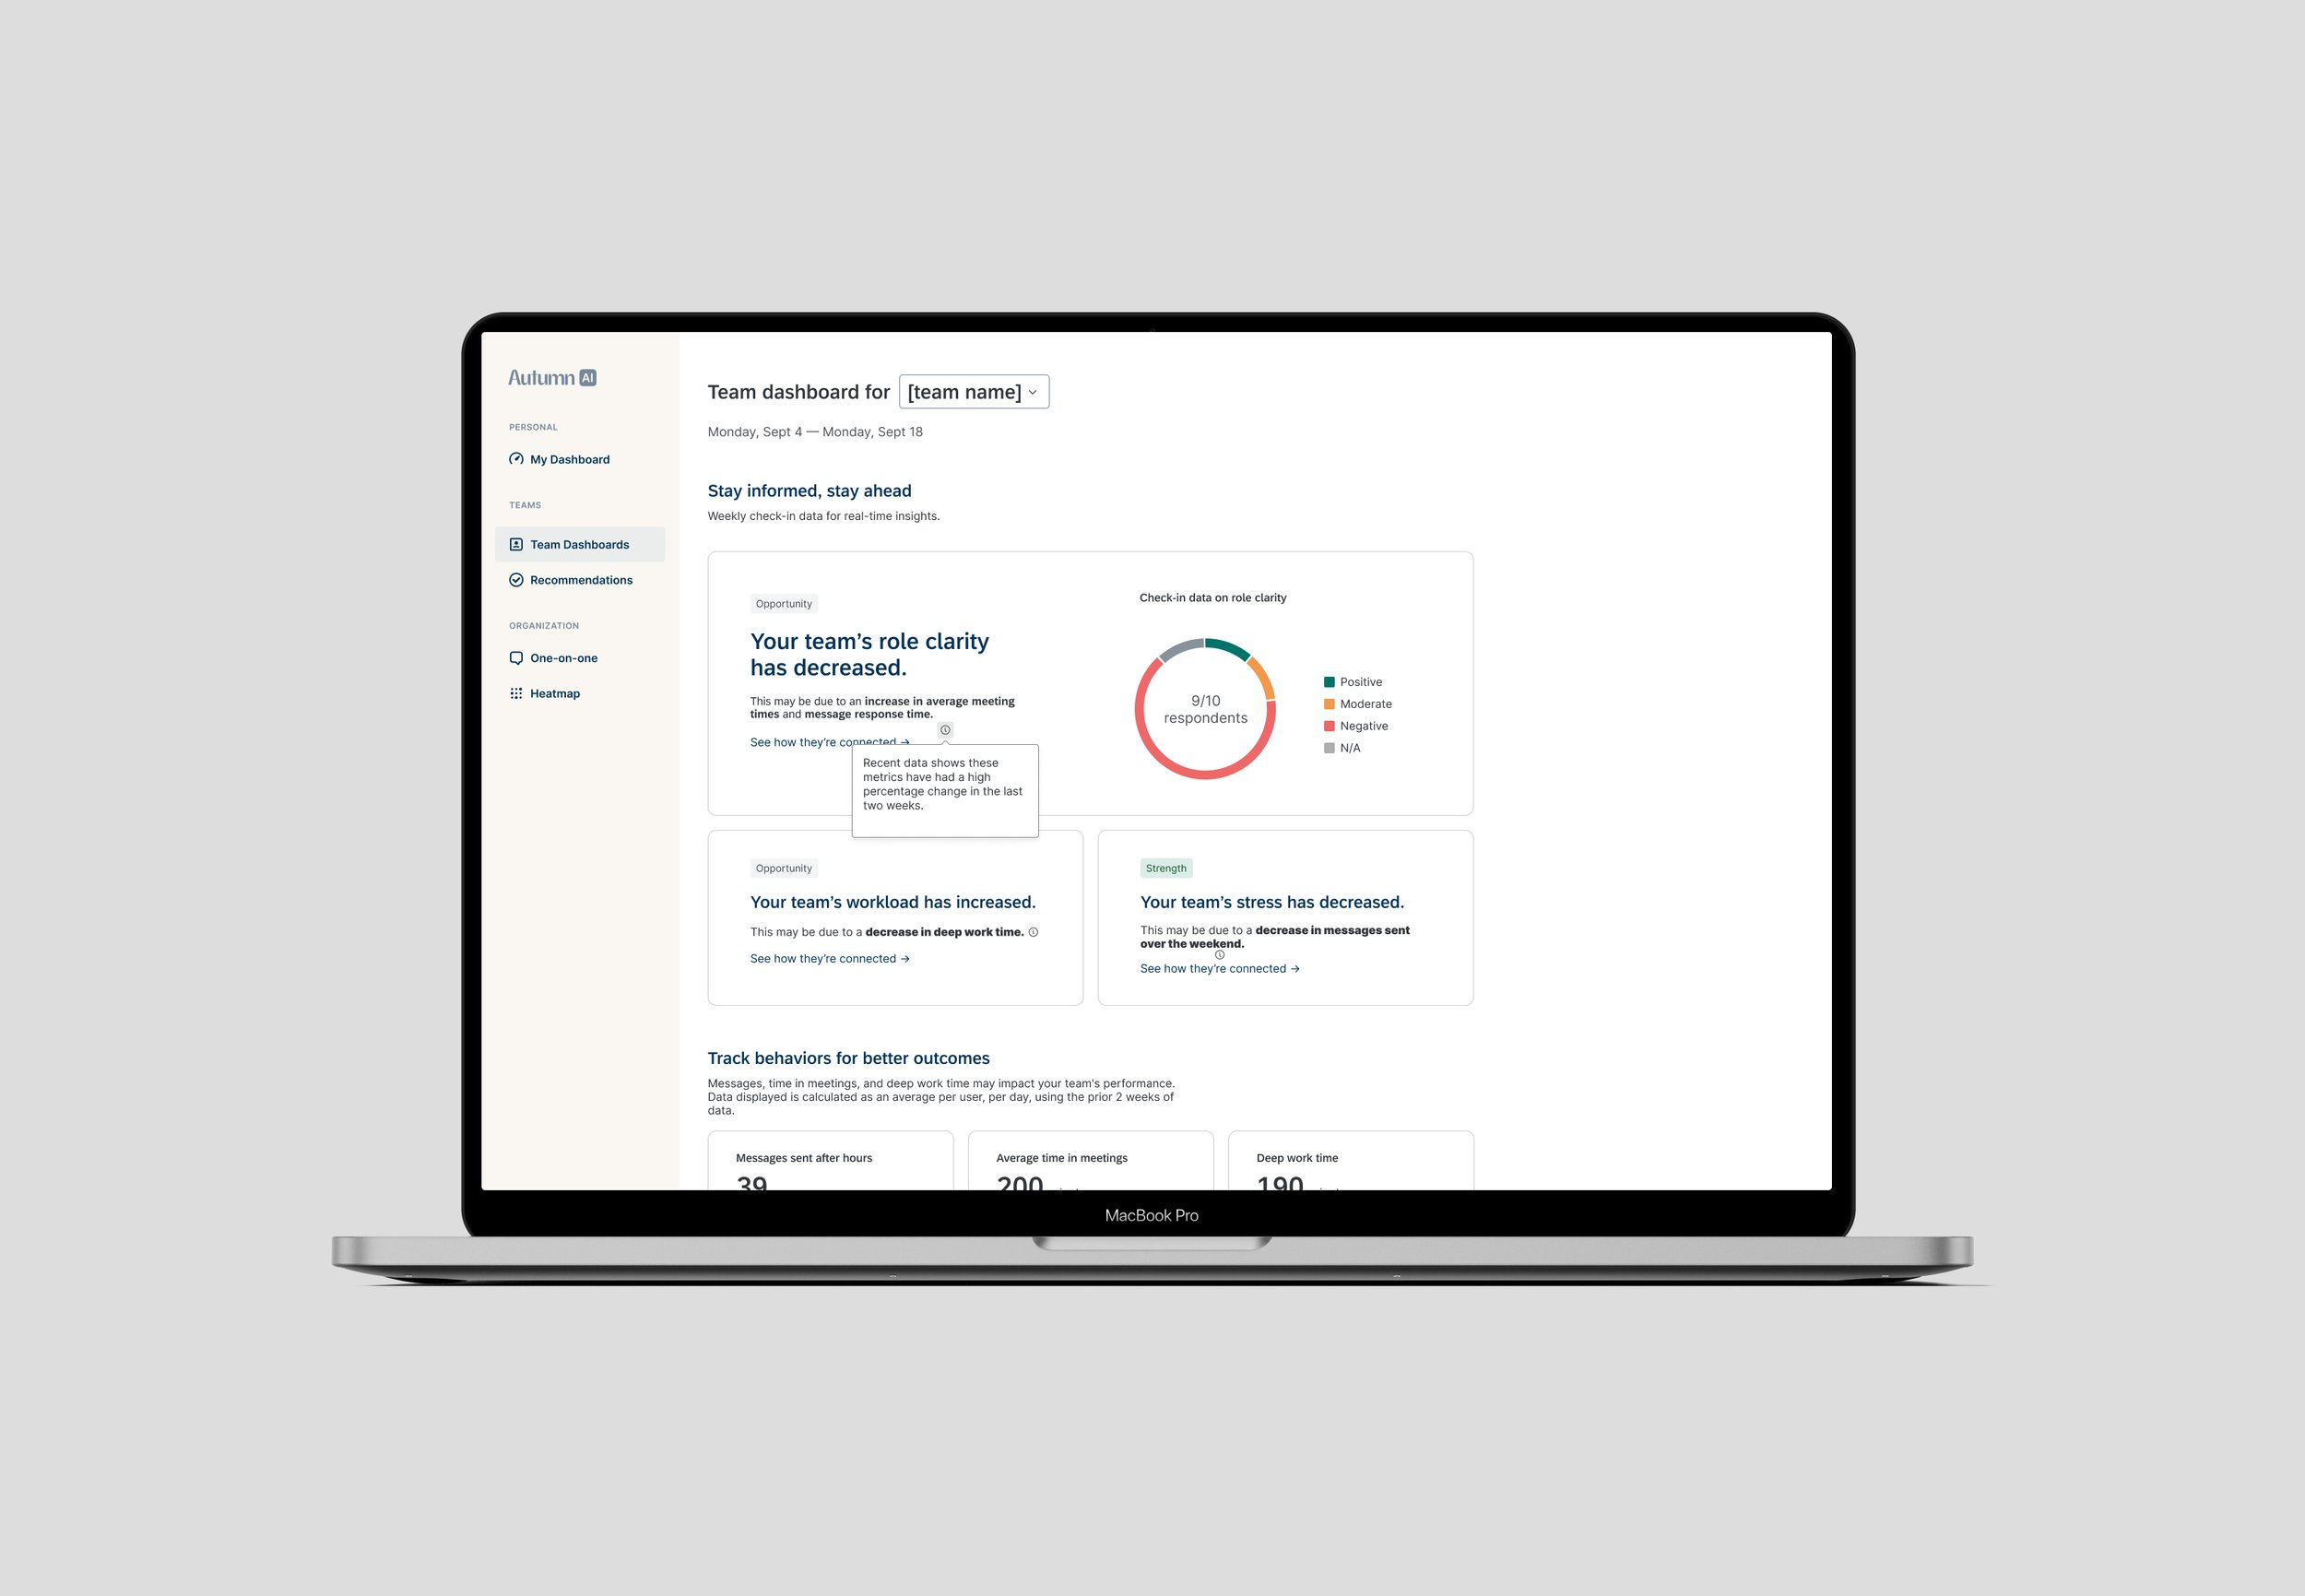
We integrated user research input the relationship between trust and explainability: which told us that for users to trust the AI-powered experience, they need to understand on a local level why something is appearing and they need to feel a sense of agency and consent in the interaction patterns. (See AI Design Systems and Frameworks for more details).
Given all these new content pattern requirements, however, we wanted to keep the experience lightweight: so we leveraged pop-overs to keep information tidy.
The concept is currently in beta with a select group of customers. This concept was highly informed by the Persona workshop that I co-led with my research partner, Rose Schneider. Special shout out to Lena Tran for her design partnership.
Team
Lena Tran (UX), Claudia Martinez (UX), Quinn Underwood (PM), Grace Van Dam (Methodology), Christian Caubautan (Eng), Will Lowe (Eng) and more.
Role
Senior Designer
Stakeholders
Product Management, Engineering, UX Leadership